The Shilling Has Been Here Before
For most of this year, the price of a dollar was background noise. Then, somewhere in September, it became the conversation.
On 5 October the shilling closed above 4,000 to the dollar for the first time. On 13 October, Bank of Uganda opened the day at 4,153, the weakest the shilling has been since records began. The next morning the central bank held a special meeting, a month ahead of schedule, and raised its main interest rate from 9.75% to 12%, its biggest increase since 2011. The shilling bounced that afternoon. By Friday it had given most of it back, closing at 4,138.
The headlines reached for the words you would expect: record low, free fall.
I don’t trade currencies. But I do work in health financing, where a lot of what we pay for is priced in dollars, so I have been watching this more closely than usual. And when something unsettles me, my habit is to go and look at the data until I understand it a little better.
There is a line from the writer Kelly Hayes that Morgan Housel likes to quote: “Everything feels unprecedented when you haven’t engaged with history.”
So this is me engaging with a little history. I am writing it down now, while it is happening, partly so that a future version of me can look back and remember how it felt.
What is going on
Bank of Uganda’s own explanation, in the statement it released after that meeting, is that several things went wrong at once. The news reports fill in the rest.
The first is oil. The war in the Middle East has disrupted shipping and pushed up the price of fuel, freight and insurance. Brent crude went from about $71 a barrel at the start of July to about $107 by mid-September, according to the government. Uganda imports all of its fuel, so we need more dollars for every litre. The Energy Minister estimated that the shilling’s slide in September and early October alone added about Shs300 to a litre of fuel.
The second is that we are earning less. Coffee export earnings in July were 18% lower than a year earlier. Tourism took a knock from travel restrictions, and visitors stayed away after the Ebola outbreak earlier this year. Bank of Uganda says the current account deficit, the gap between the dollars we spend abroad and the dollars we earn, widened by $1.4 billion to $4.6 billion.
The third is money leaving. Over the past two years, foreign investors bought a lot of Ugandan government bonds, attracted by high interest rates. By June this year they held about $2.7 billion of our government’s debt. Now that interest rates abroad look more attractive and investors everywhere are nervous, some of that money is heading for the door. Citigroup estimated that over $200 million left in just two weeks.
Add importers, energy firms and telecoms buying dollars early ahead of the year-end rush, and you have more people wanting dollars than there are dollars on offer.
Then there is the question of what to do about it. Central banks can sell dollars from their reserves to slow a fall. On 9 October, President Museveni said publicly that Bank of Uganda had proposed doing exactly that, and that he had refused. He described the fall as a global problem driven by the wars in the Middle East, said a weaker shilling is good for exporters, who earn more shillings for every dollar, and argued that reserves should not be spent propping up imports. He urged Ugandans to import less. The reserves stood at about $6.5 billion in August, a little over three and a half months of imports. Bank of Uganda’s officials have said the shilling is market-determined, and the bank has leaned on other tools instead: raising the share of deposits that banks must keep with it to 13.5% in September, and then the interest rate rise this week.
Is it us, or is it the dollar?
The first thing I wanted to know was whether this is a Uganda story or a dollar story. When the dollar gets stronger, almost every currency weakens against it, and you would expect the shilling to fall alongside our neighbours.
That is not what happened.
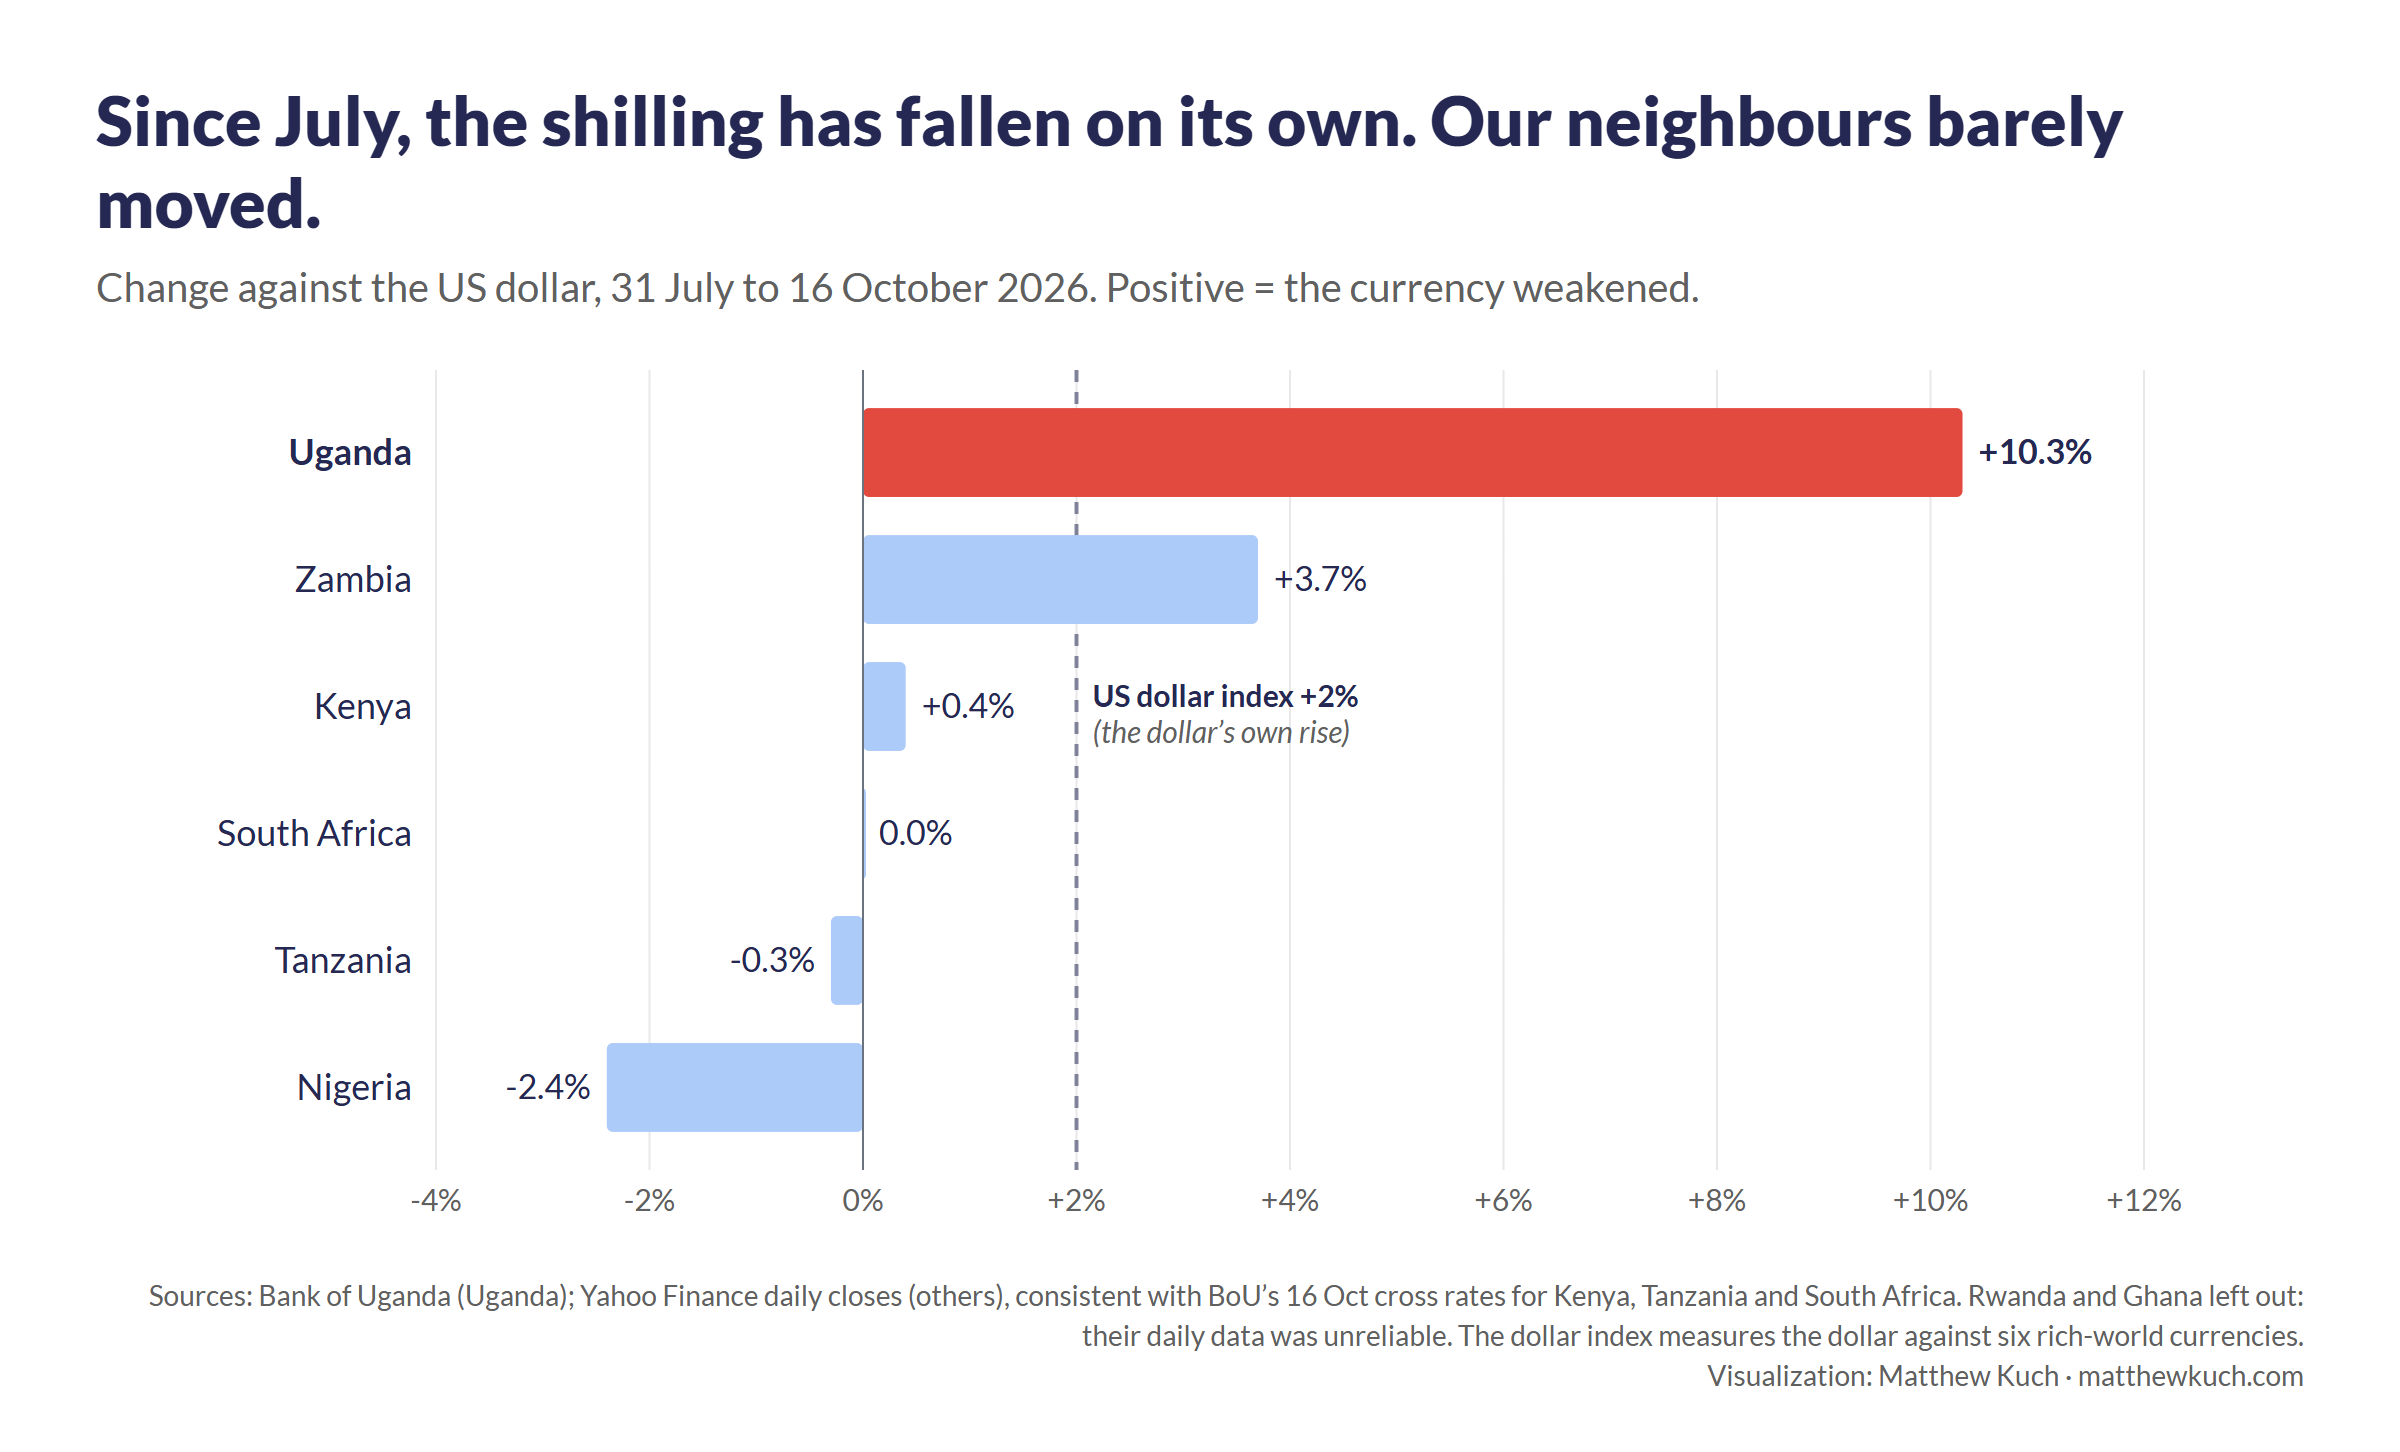
Since the end of July, the dollar has risen about 2% against the major world currencies. Over the same period, a dollar got 10% more expensive in Kampala. In Nairobi and Dar es Salaam, the price barely moved. Bloomberg reported that since late August, the shilling has fallen further than any of the 144 currencies it tracks.
So the global forces are real, but they have landed harder here than next door. My reading is that this points to the things specific to Uganda: the foreign money that had piled into our bond market, and an import bill that grew faster than our exports.
Have we been here before?
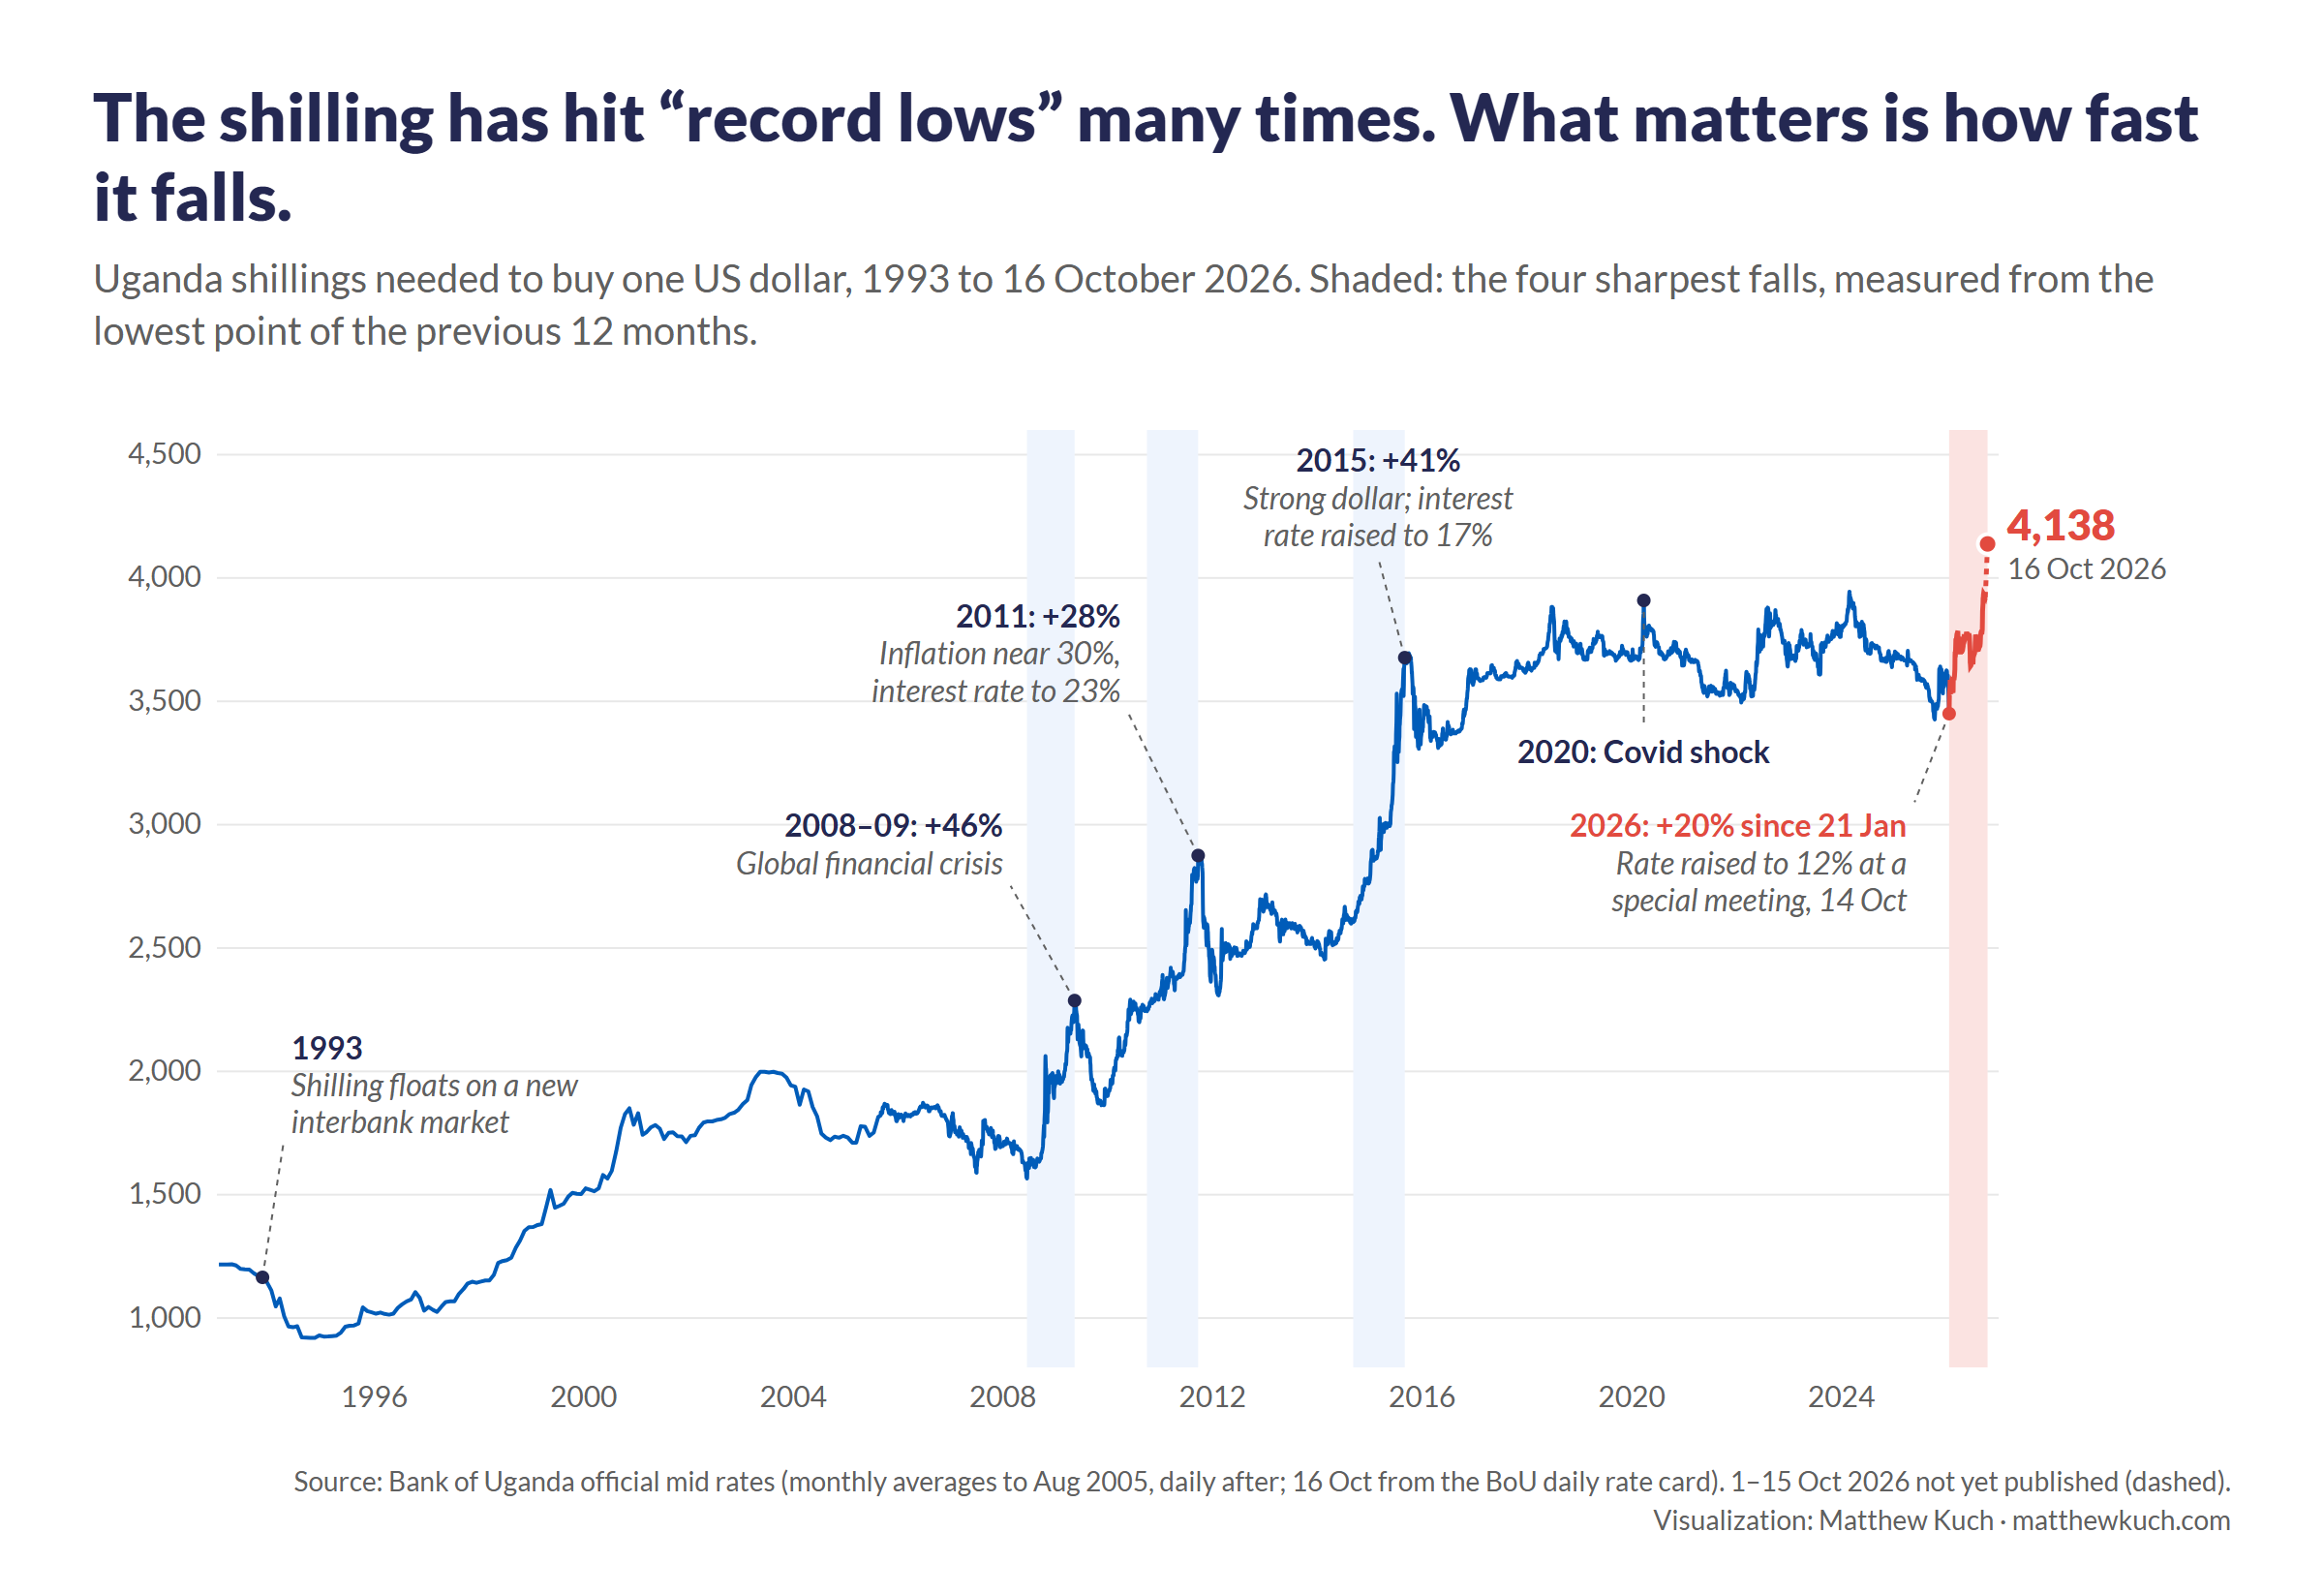
On the long chart at the top, a dollar cost about 1,200 shillings in 1993, when the shilling started trading freely on a new interbank market. It costs about 4,100 today. Over 33 years, the price has climbed in a series of steps, and every step up set a new record.
I counted. Between 2005, when Bank of Uganda’s daily data begins, and this September, the shilling hit a new all-time low on 153 separate days, spread across eight different years. October has added a few more. “Record low” is a headline we have read many times before. It is almost guaranteed to come back, because prices in Uganda have risen faster than prices in America for as long as anyone can remember, and the exchange rate slowly follows.
Go back a little further and the 1980s make today look calm. In May 1987, the government introduced the new shilling, knocked two zeros off the old one, took a 30% tax on the cash people converted, and devalued: overnight, a dollar went from 14 new shillings to 60. Inflation at the time was well over 200% a year. Between 1986 and 1993, the price of a dollar went up more than 80 times. People lived through that, and many of them are still around to tell you about it.
So the level isn’t the useful question. The useful question is how fast it is falling, because speed is what hurts. A slow, steady slide gives businesses and households time to adjust. A sudden drop doesn’t.
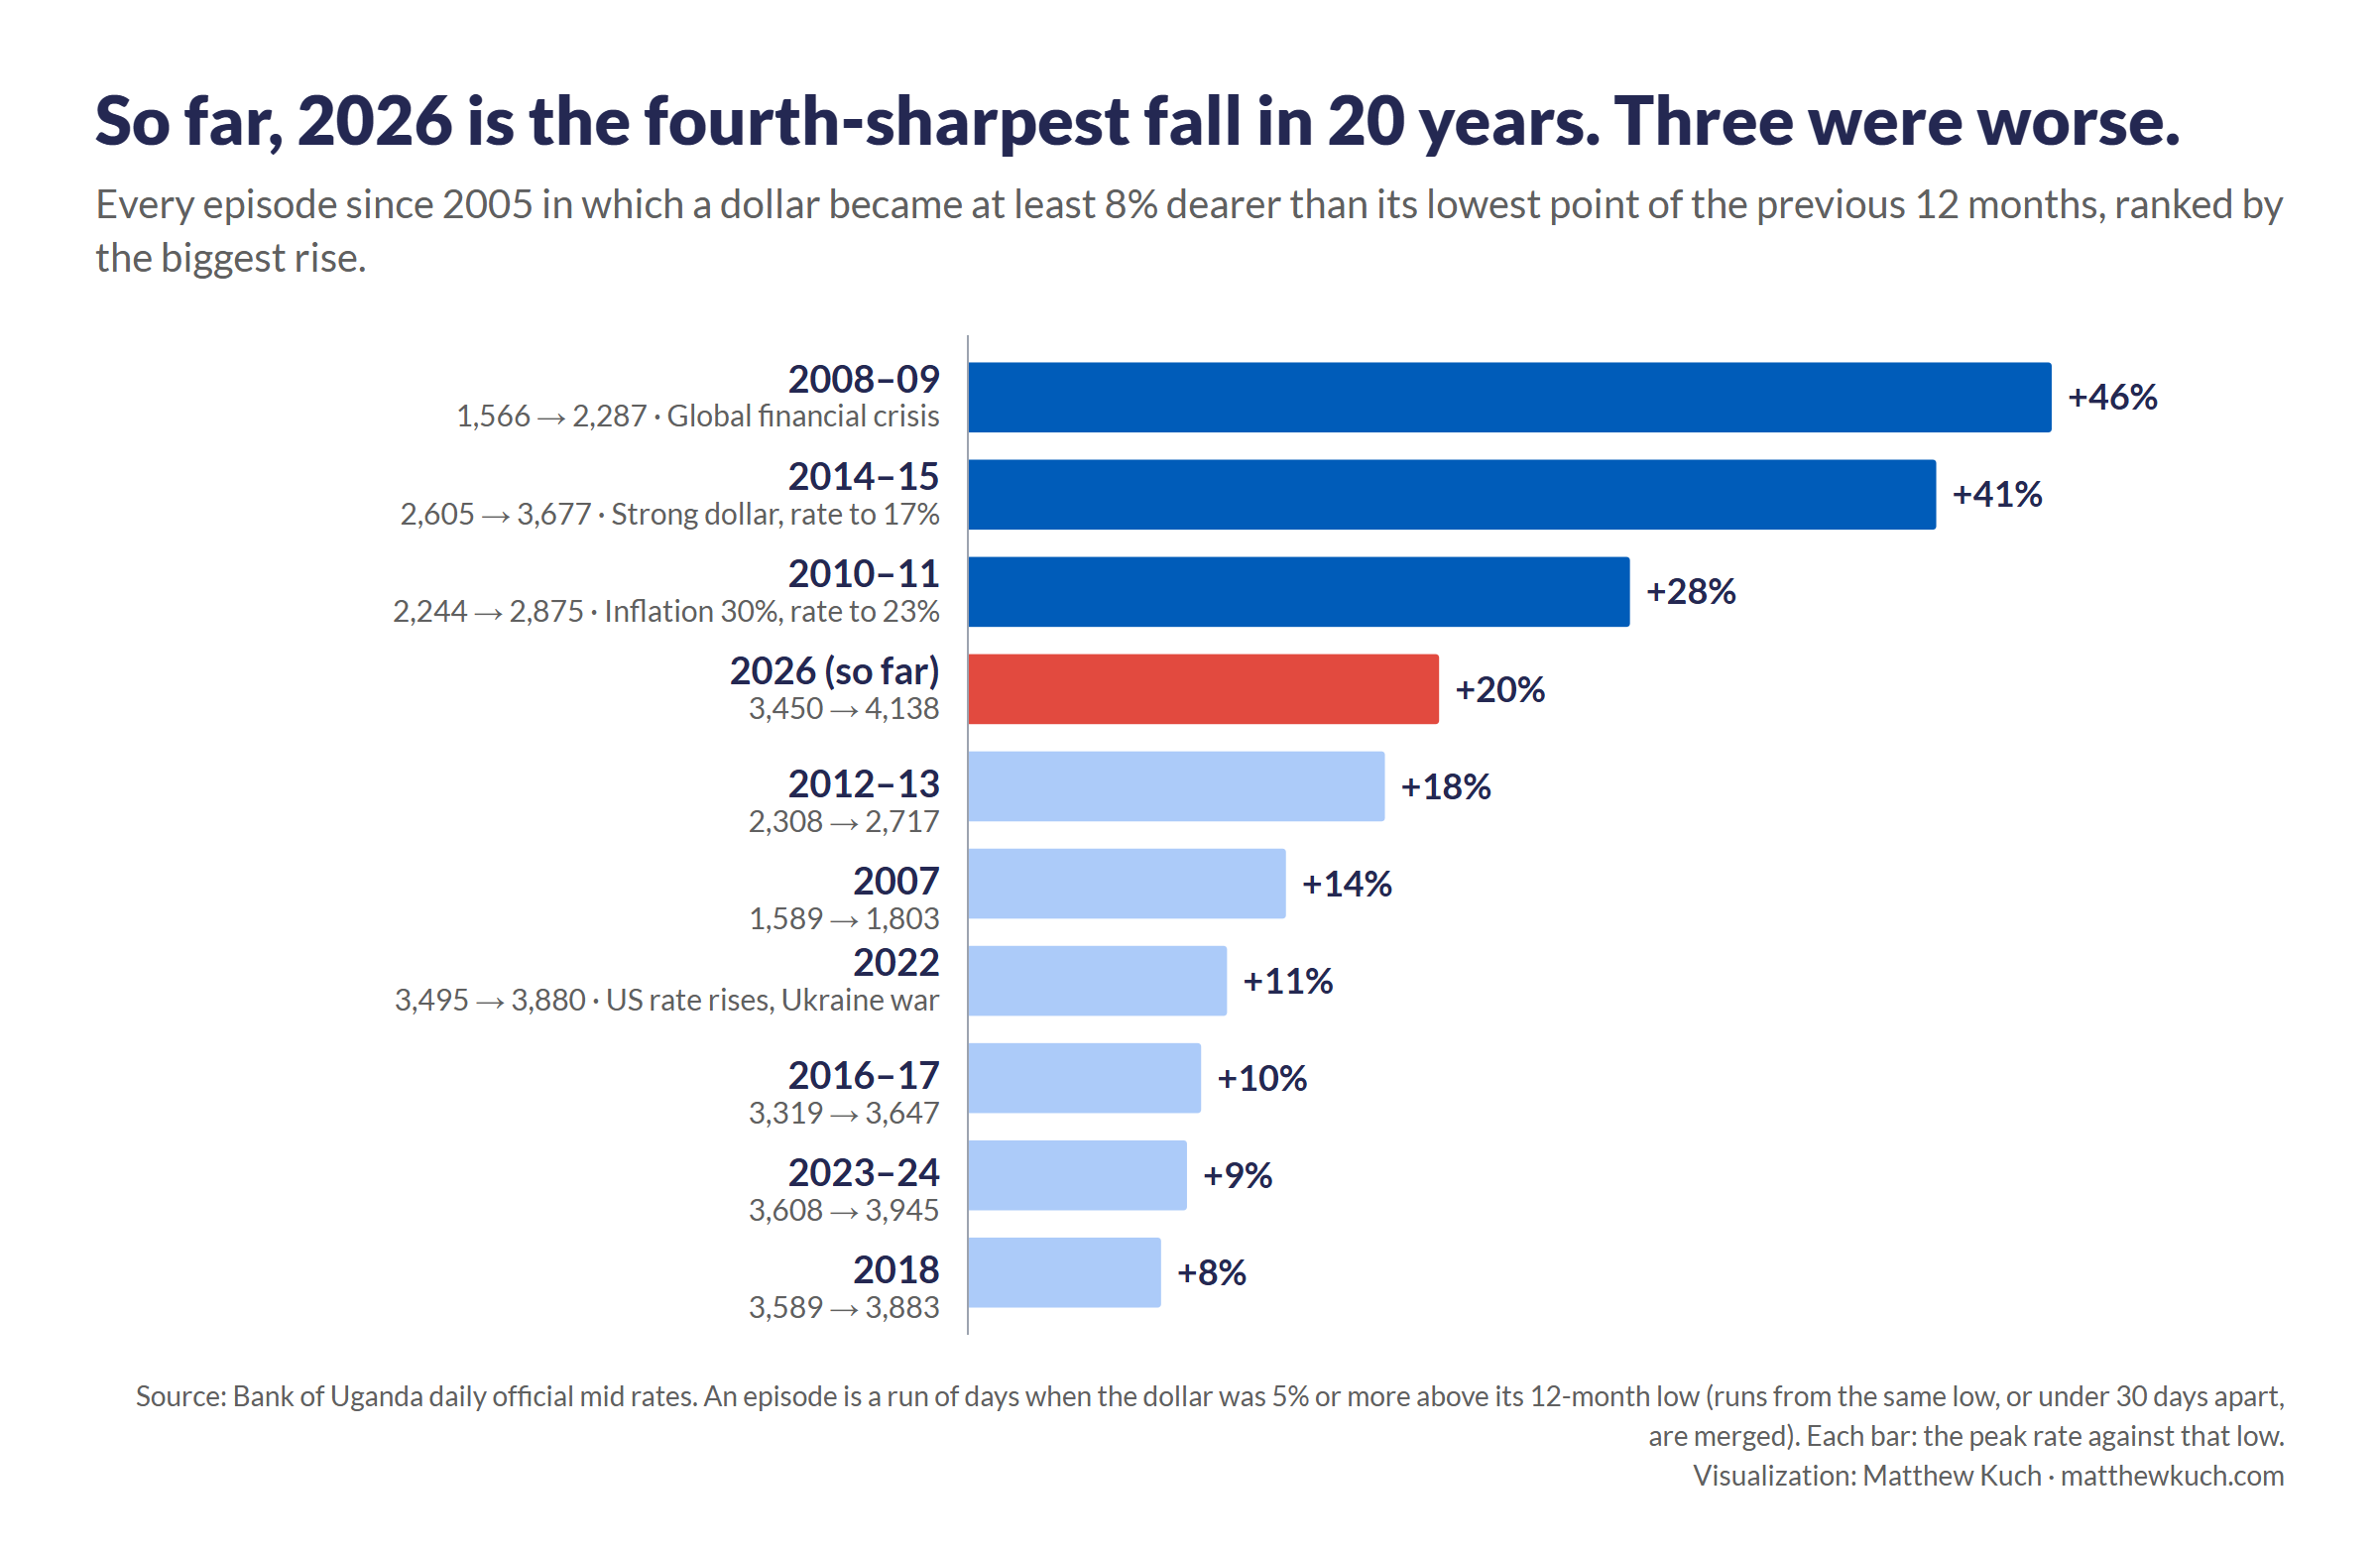
By that measure, 2026 is bad but not the worst. From its strongest point this year, on 21 January just after the elections, the shilling has lost about a sixth of its value: a dollar costs 20% more. In 2008–09, during the global financial crisis, a dollar got 46% more expensive within a year. In 2015, it was 41%. In 2011, it was 28%, inflation hit 30% and Bank of Uganda pushed its interest rate to 23%.
Some of these stories rhyme with today in ways I didn’t expect.
In July 2015, after spending more than $200 million defending the shilling, Governor Emmanuel Tumusiime-Mutebile said: “It is not sustainable for the Bank of Uganda to try and prop up the exchange rate.” Different decade, different people, same argument about reserves.
The 2015 storm was regional, though. The Tanzanian shilling fell about as much as ours that year, and the Kenyan shilling fell too. This time, we are mostly on our own.
And each of the big episodes eventually turned. By the end of 2009, the shilling had won back about half of what it lost in the financial crisis. Most of the 2011 fall was reversed by early 2012, once the high interest rates bit. The long chart also shows that the shilling rarely went all the way back to where it started. Each storm left it a step higher than before.
The real-terms view
There is one more way to look at this, and it surprised me.
Because prices in Uganda rise faster than in the countries we trade with, the shilling has to lose some value every year just to stand still. Economists adjust for this using something called the real effective exchange rate, which accounts for inflation and for all our trading partners, not just America. Bank of Uganda publishes it every month.
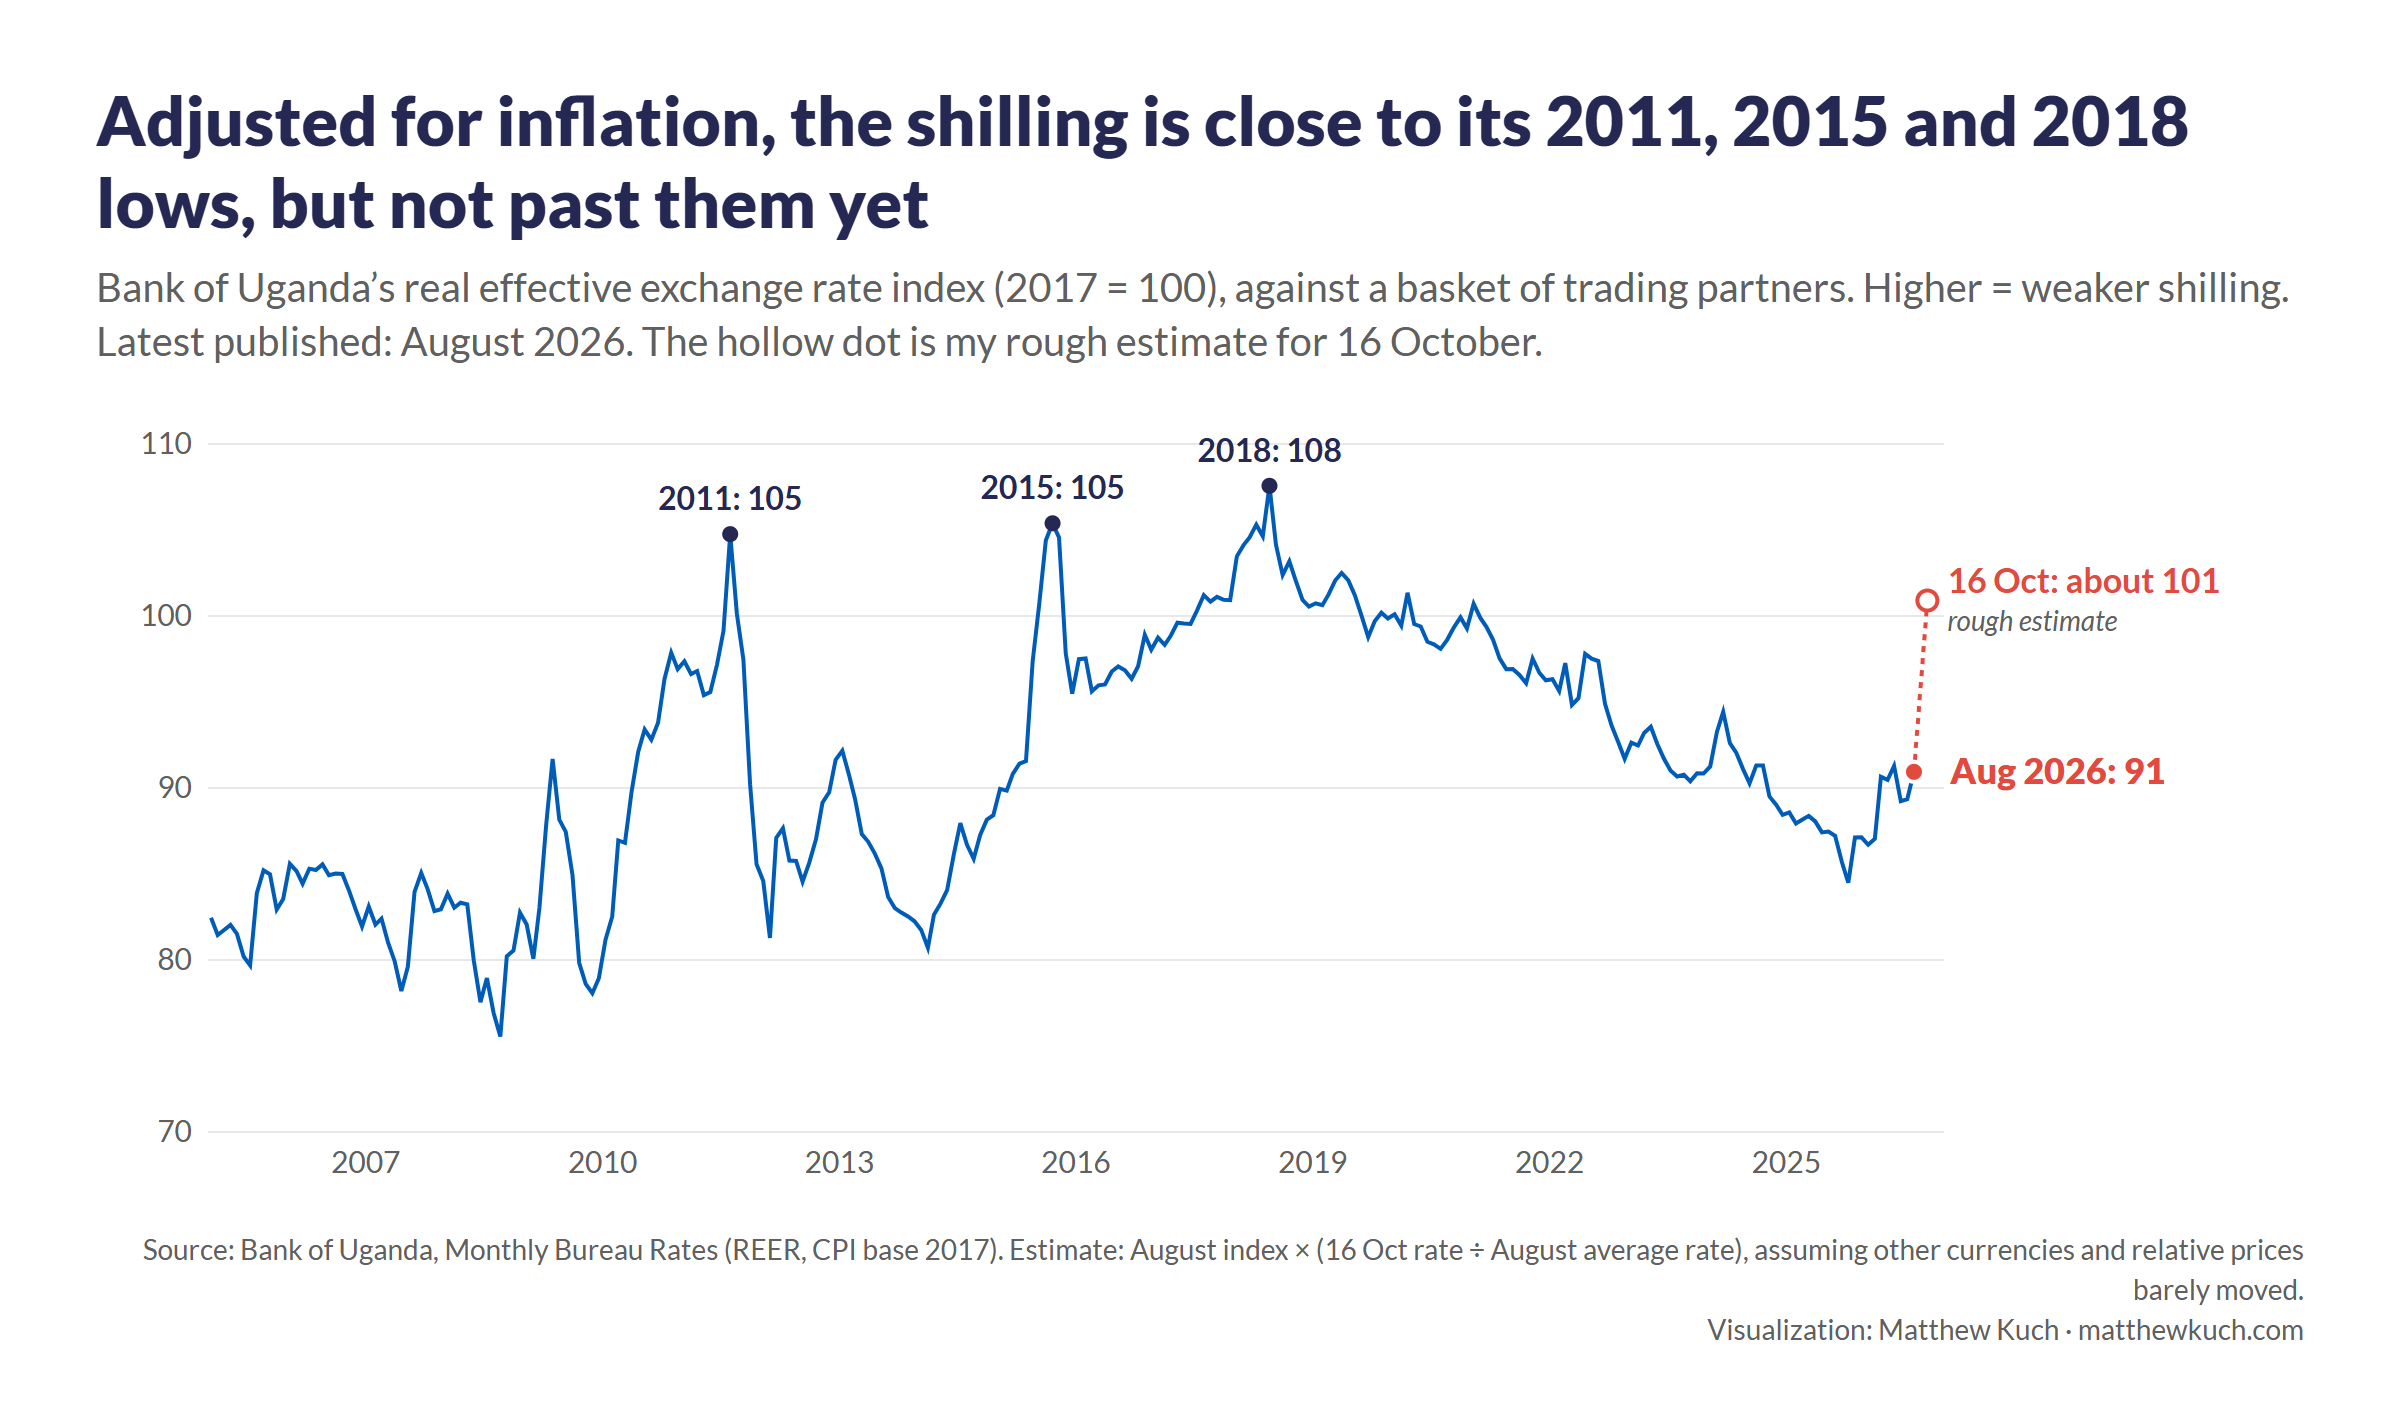
On this measure, the shilling in August 2026 was at 91. At the worst moments of 2011 and 2015, it was at 105. In 2018 it reached 108. The figures for September and October aren’t out yet, and the shilling has fallen a long way since August. If I scale August’s figure by how much the dollar rate has moved since, I get roughly 101 at today’s rate. That is only a rough estimate, but it says we are close to those old lows, within about 5%, without having passed them.
This doesn’t make 4,138 painless. The bills people pay are in nominal shillings, not in index points. But it does mean that, adjusted for inflation, this is not yet the weakest the shilling has been. It is getting close.
What it means
For households, the most visible effect is fuel. Petrol prices in September were 31% higher than a year earlier, and diesel 42.5% higher. Bank of Uganda now expects inflation to average 7 to 7.5% over the next year, up from 4.6% in September, and growth to slow.
In my own world of health financing, the arithmetic is uncomfortable. Many medicines, test kits and other health commodities are bought in dollars. A health budget set in shillings for this financial year, which began on 1 July when a dollar cost about 3,666, buys roughly 11% less at 4,138. Nobody announces that cut. It just happens, quietly, at the point of purchase.
What history does and doesn’t tell us
So, is this moment unprecedented?
Measured in shillings per dollar, yes, technically. But we set that kind of record on 153 days between 2005 and this September.
Measured by speed, no. Three falls in the last twenty years were sharper.
Measured in real terms, not yet. The shilling was weaker in 2011, 2015 and 2018, though the gap has narrowed.
What does feel new is the mix: an oil shock from a war far away, arriving just as foreign money had become a much bigger part of our bond market, plus a public decision not to spend reserves defending the currency. I don’t know how this one ends. Nobody does. The shilling could recover some ground as the rate rise takes effect, or it could keep sliding if oil stays high and the money keeps leaving.
History can’t tell you what happens next. What it can tell you is what kinds of things tend to happen, and that people have been through worse and adjusted. The shilling has been here before. So have we.
I’ll come back to this post in a year and see how it reads.
Notes and Sources
- Exchange rates: Bank of Uganda official mid rates, from its Exchange Rates workbook (monthly averages from 1981, daily rates from September 2005 to 30 September 2026). The 16 October figure (4,138.10, closing mid rate) is from Bank of Uganda’s daily rate card. The 2, 5, 13 and 14 October figures are Bank of Uganda rates as reported by UG Business, Pulse Uganda and BusinessDay/Reuters. Daily data for 1 to 15 October was not yet published, so the chart joins 30 September to 16 October with a dashed line. I cross-checked the series against the BIS and the World Bank (from IMF data); they closely match.
- How the falls are measured: for every day since September 2005, the rate that day compared with the lowest rate in the previous 12 months. An episode is a run of days when the dollar was at least 5% above that low (runs measured from the same low, or less than 30 days apart, are merged), and its size is the biggest value in the run. The chart shows every episode that reached 8% or more. The same rule is used for every episode, including 2026. Measured from 31 December 2025 instead of the January low, a dollar costs 14% more this year.
- Record lows: a day on which the shilling was weaker than on any earlier day in the daily series and than any earlier monthly average back to 1981. There were 153 such days between September 2005 and 30 September 2026, in 2008, 2009, 2010, 2011, 2015, 2018, 2020 and 2024. The previous record was 3,945 on 26 February 2024. October 2026 broke it in its first days: Bank of Uganda’s rate closed at 3,966.90 on 2 October (Pulse Uganda).
- Other currencies: Yahoo Finance daily closes, 31 July to 16 October 2026. Rwanda and Ghana are left out because their daily data jumped between two values from one day to the next. These agree with Bank of Uganda’s own cross rates for Kenya, Tanzania and South Africa on 16 October, and with the Central Bank of Kenya rate. The “worst of 144 currencies” figure is from Bloomberg, measured from 25 August (also reported via Briefs).
- Real effective exchange rate: Bank of Uganda, Monthly Bureau Rates sheet, CPI base 2017 = 100. A higher number means a weaker shilling. My estimate for 16 October is the August index multiplied by the 16 October rate divided by the August average rate (3,730). It assumes prices and our trading partners’ currencies barely moved since August, which is roughly true for Kenya, Tanzania and South Africa. It is a rough guide, not an official figure.
- Causes, interest rate and inflation forecast: Bank of Uganda Monetary Policy Statement, 14 October 2026 (Middle East, freight and insurance, current account, coffee and cocoa, tourism, the rate rise, inflation and growth). Ebola and tourism: Daily Monitor. Oil prices (a cabinet minister’s figures) and the Energy Minister’s Shs300 per litre estimate: The Independent. Coffee earnings: Daily Monitor. Foreign holdings of government debt: Uchumi360. Year-end dollar demand: CNBC Africa/Reuters. “Market-determined”: Bank of Uganda officials in the Daily Monitor. Reserves: UG Business. Citigroup’s outflow estimate: Bloomberg (above). Cash reserve requirement: PML Daily. Fuel price inflation for September: UG Business (first link above).
- The President’s remarks on reserves (9 October): Daily Monitor and Nile Post.
- History: 1987 currency reform: World Bank (1987) and IMF. 2008–09: ODI (2010). 2011: IMF Country Report 12/135. 2015: IMF Country Report 16/145, and Mutebile’s remarks in the Daily Monitor. Regional currencies in 2015: Daily Monitor.
- The quote: Kelly Hayes, on Twitter, July 2020, as quoted by Morgan Housel in Engaging With History.
- Charts and analysis are my own. Written on 17 October 2026; the numbers will move.